|
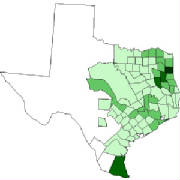
1850
Total
212,592
Highest
11,842
Harrison County
Lowest
200
San Patricio County
| Population Density 1850 |
|
| The darker colors represent a higher density of population |
|
 |
|
|
|
|
|
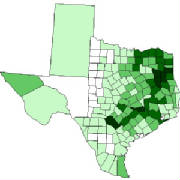
1860
Total
604,215
Highest 15,803
Rusk County
Lowest
26
Zavala County
| Population Density 1860 |
|
| The darker colors represent a higher density of population |
|
|
|
|
|

